
In the study of differential equations, graphical methods often provide a deeper understanding of solutions. One of the most useful graphical techniques is the phase-line portrait, particularly for autonomous equations. In this article, we'll explore phase-line portraits in detail, providing clear explanations and examples with graphs to illustrate the concepts.
1. What is a Phase-Line Portrait?
A phase-line portrait is a graphical representation of the solutions of an autonomous differential equation, which is an equation of the form:
In a phase-line portrait, the behavior of the solutions is represented along a horizontal line, showing the direction of motion of the solution as time progresses. The key idea is to determine the sign of
Steps to Create a Phase-Line Portrait
1. Identify Critical Points:
- Find all points where
- Identify any points where
2. Determine the Sign of
- For each subinterval between the critical points and points where g is undefined, determine whether
3. Draw the Phase-Line:
- Mark the stationary points with dots (•) on the phase-line.
- Use arrows to indicate the direction of motion in each subinterval:
- A right arrow (-->) indicates
- A left arrow (←) indicates
4. Analyze the Stability:
- Determine the stability of each stationary point:
- Stable Point: Solutions move towards this point over time. On a phase line, arrows point towards the stable point from both sides.
- Unstable Point: Solutions move away from this point over time. On a phase line, arrows point away from the unstable point on both sides.
- Semi stable Point: Solutions move towards this point from one side but away from it on the other side. On a phase line, arrows point towards the semi stable point from one side and away from it on the other side.
2. Examples and Graphical Illustrations
2.1. Example 1: A Simple Cubic Equation
Differential Equation:
This equation tells us how the variable
Step 1: Identify Critical Points
Critical points, also known as equilibrium or stationary points, are values of y where the derivative
1. Set the equation equal to zero:
2. Factor the equation:
3. Factor further:
4. Solve for
So, the critical points are
Step 2: Determine the Sign of
Next, we need to understand the behavior of
The regions are:
(-\infty, -2) \ (-2, 0) \ (0, 2) \ (2, \infty) \
To check the sign of
1. For y in (
- Choose y = -3 .
- Substitute y = -3 into
- The sign is positive, so
2. For
- Choose
- Substitute
- The sign is negative, so
3. For
- Choose
- Substitute
- The sign is positive, so
4. For
- Choose
- Substitute
- The sign is negative, so
Step 3: Draw the Phase-Line
The phase line is a simple diagram that shows the direction of the change of
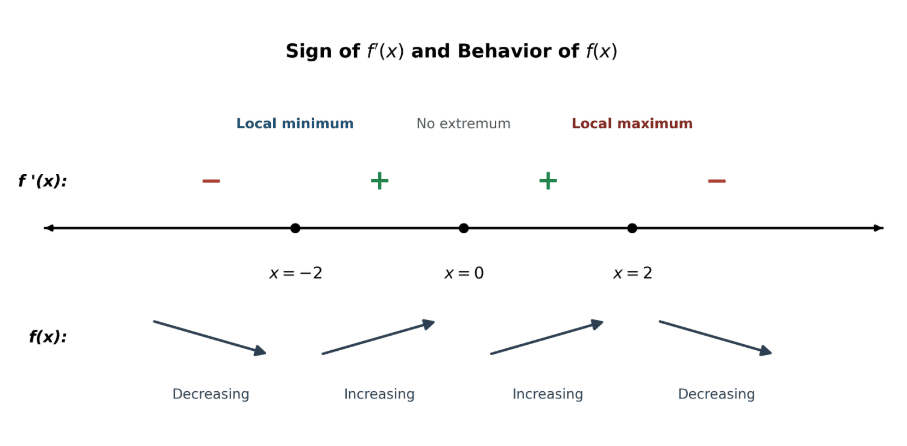
This shows:
-
-
-
-
Step 4: Analysis of Stability
Now, let's analyze the stability of these critical points:
- Stable Points:
- If
- The same happens for
- Unstable Point:
- If
Interpretation:
- If the initial value of
- If the initial value of
The points
Graphical Illustration
Differential Equation:
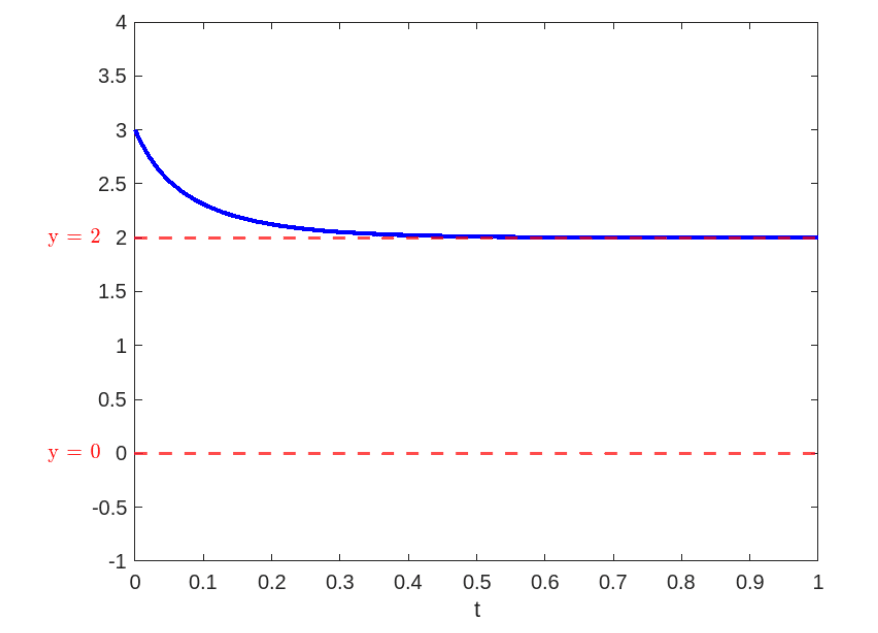
Individual Graphs for Initial Values
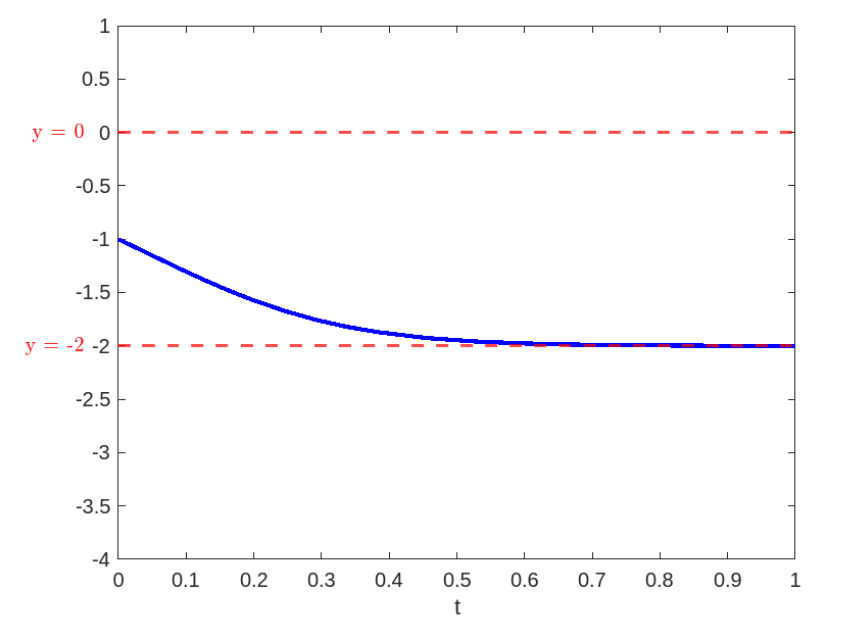
1. For
- Description:
This graph shows the trajectory of
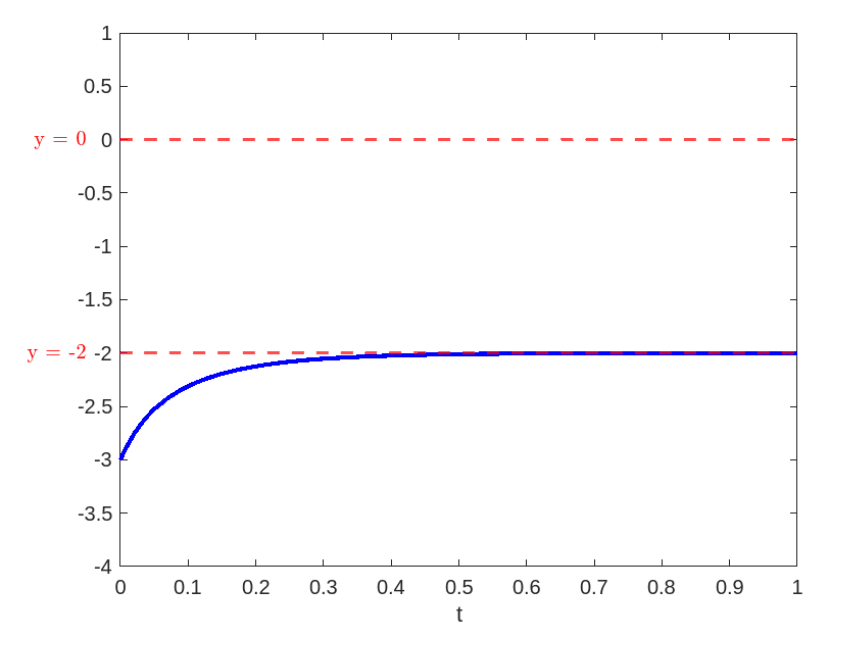
2. For
- Description:
This graph represents the trajectory starting at
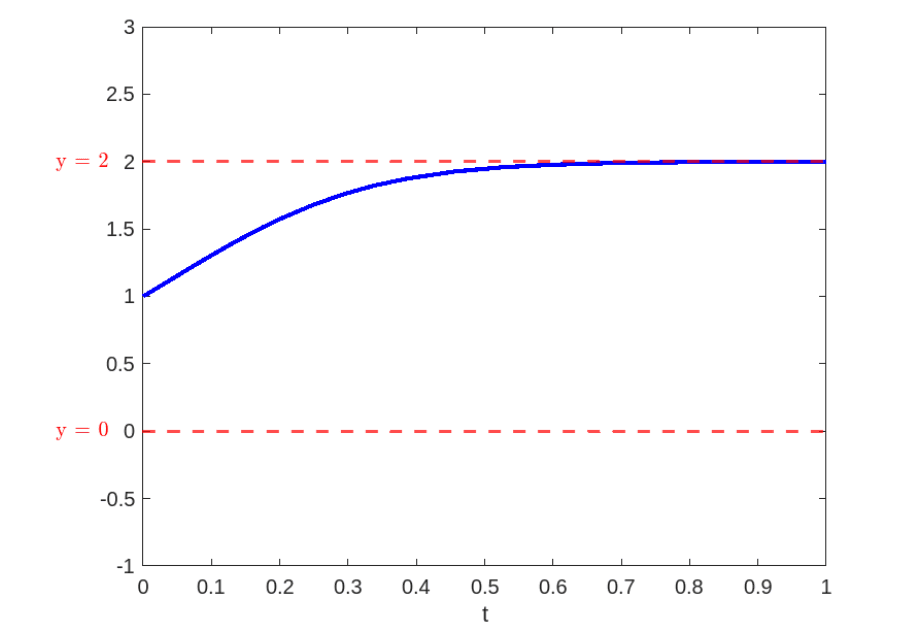
3. For
- Description:
This graph depicts the trajectory starting at
4. For
- Description:
This graph illustrates the trajectory starting at
Final Plot with All Trajectories
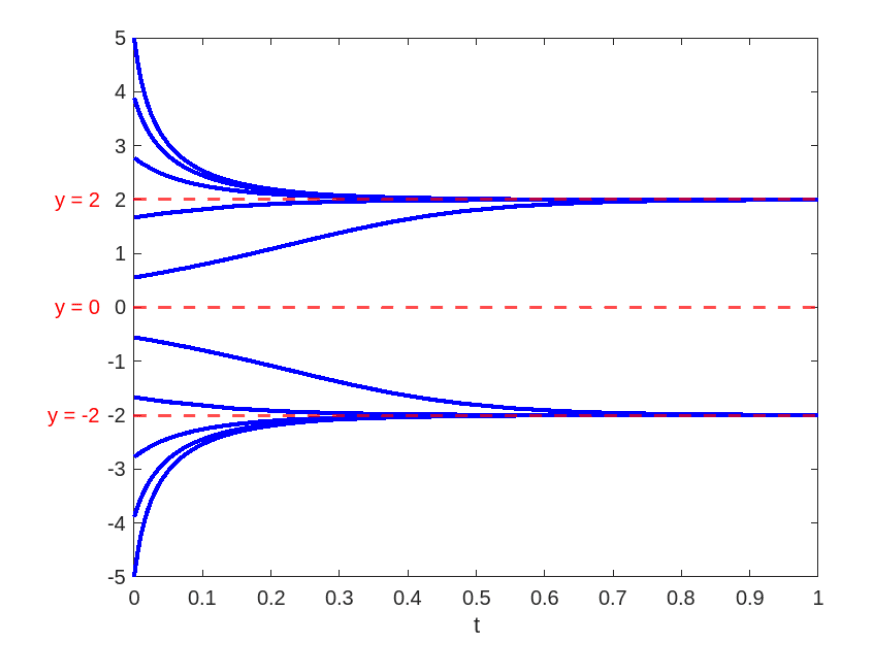
Description:
The final plot combines all the individual trajectories starting from the initial values
Matlab Code to Generate the Final Plot:
%Choose 10 initial values y(0) between -5 and 5

c = linspace(-5, 5 , 10);

%Range for t axis

x = [0 1;

critical_points = [-2, 0, 2;

f = @(t,y) 4*y - y^3;

%Solve IVP for each initial value and plot them

for a = c

    disp(a);

    [t,yval = ode15s(f, x, a);

    plot(t, yval, 'Color', [0, 0, 1, 'LineWidth',2)

    xlabel('t')

    ylabel('y', 'Rotation',0)

    hold on

end

%Plot horizontal asymptote lines for each critical point

for p = critical_points

    yline(p,'--', 'LineWidth', 1.5, 'Color', [1, 0, 0);

end

hold off
This MATLAB code generates the plot by solving the initial value problem for various starting points and plotting the trajectories along with the critical points.
If you like more exploration on plotting these types of graphs can start with the above MATLAB code and proceed in plotting various graphs to identify their behavior.
2.2. Example 2: A Quadratic Equation
Step 1: Identify Critical Points
Critical points are the values of
1. Set the equation equal to zero:
2. Solve for
-
-
-
So, the critical points are
Step 2: Determine the Sign of
To understand the behavior of
-
-
-
-
We will substitute a value of
1. For
- Choose
- Substitute
- The sign is negative, so
2. For
- Choose
- Substitute
- The sign is positive, so
3. For
- Choose
- Substitute
- The sign is negative, so
4. For
- Choose
- Substitute
- The sign is negative, so
Step 3: Draw the Phase-Line
Now that we know the signs in each interval, we can draw the phase line:
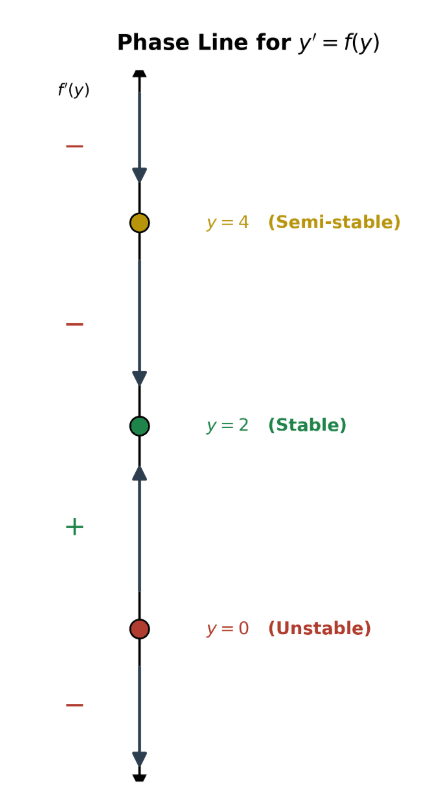
Analysis:
- Stable Points:
- If
- If
- Unstable Point:
- If
Graphical Illustration:
Final Plot with trajectories
The final plot provides a comprehensive view of the system described by the differential equation
- For initial values less than
- For initial values between
- For initial values between
- For initial values greater than
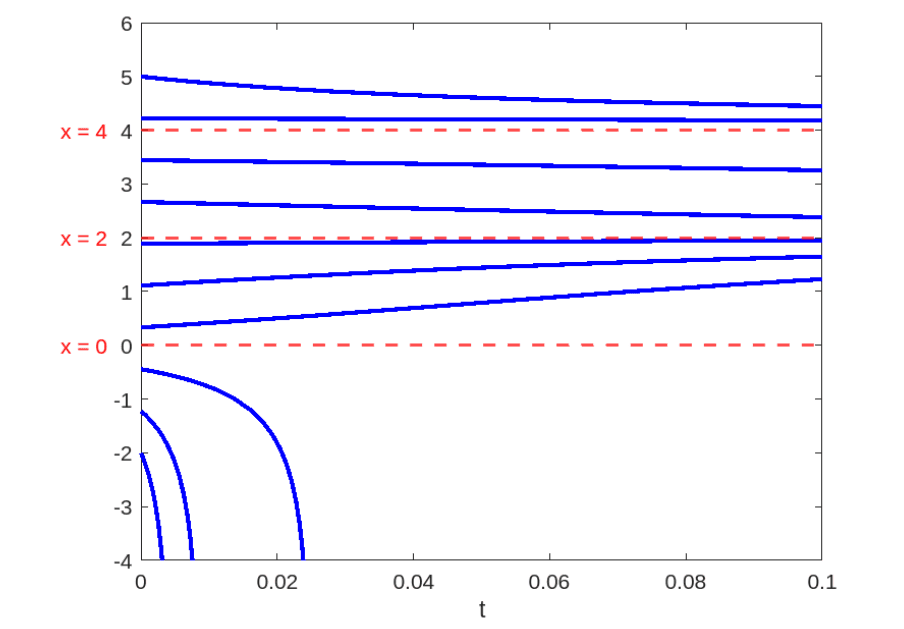
The plot effectively demonstrates the stability of the critical points
The article continues: Phase-Line Portraits for Autonomous Equations II